
In case you missed it in your inbox, check out our September 2018 Newsletter here!
Email Opt-Put Infographic #3
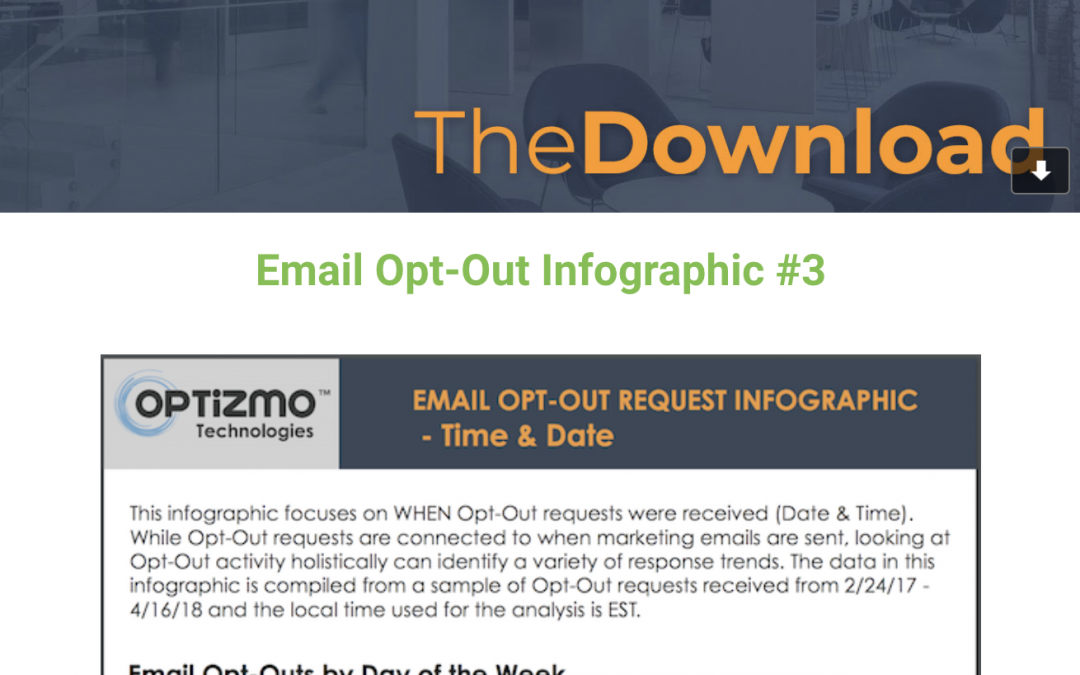
Today we are releasing the third installment in our Email Opt-Out Requests Infographic series. The series delivers the most comprehensive look at Opt-Out activity available in the industry – leveraging a large data set of sample Opt-Out requests (nearly 200 million requests) collected over a 14-month period.
Earlier infographics in the series focused on WHERE Opt-Out requests came from (geography and email provider) and WHAT technology was involved in those requests (device, browser, etc.). The third and final infographic in the series looks at WHEN Opt-Out requests are received (day of the week, hour of the day, etc.). While Opt-Out activity is clearly tied to the date/time email campaigns are sent, it can be instructive to look at Opt-Out trends on their own.
You’ll learn which day of the week sees the most Opt-Out activity (it may not be the date you expect), how Opt-Out requests are generated over the course of the day, and data points around various holidays over the past year.
Click here to download your copy
If you have any questions about the infographic, please reach out to us at support@nulloptizmo.com.
Check out the rest of our September 2018 Newsletter here!